Staring Isn't Selling
What the morning stats ritual costs you.
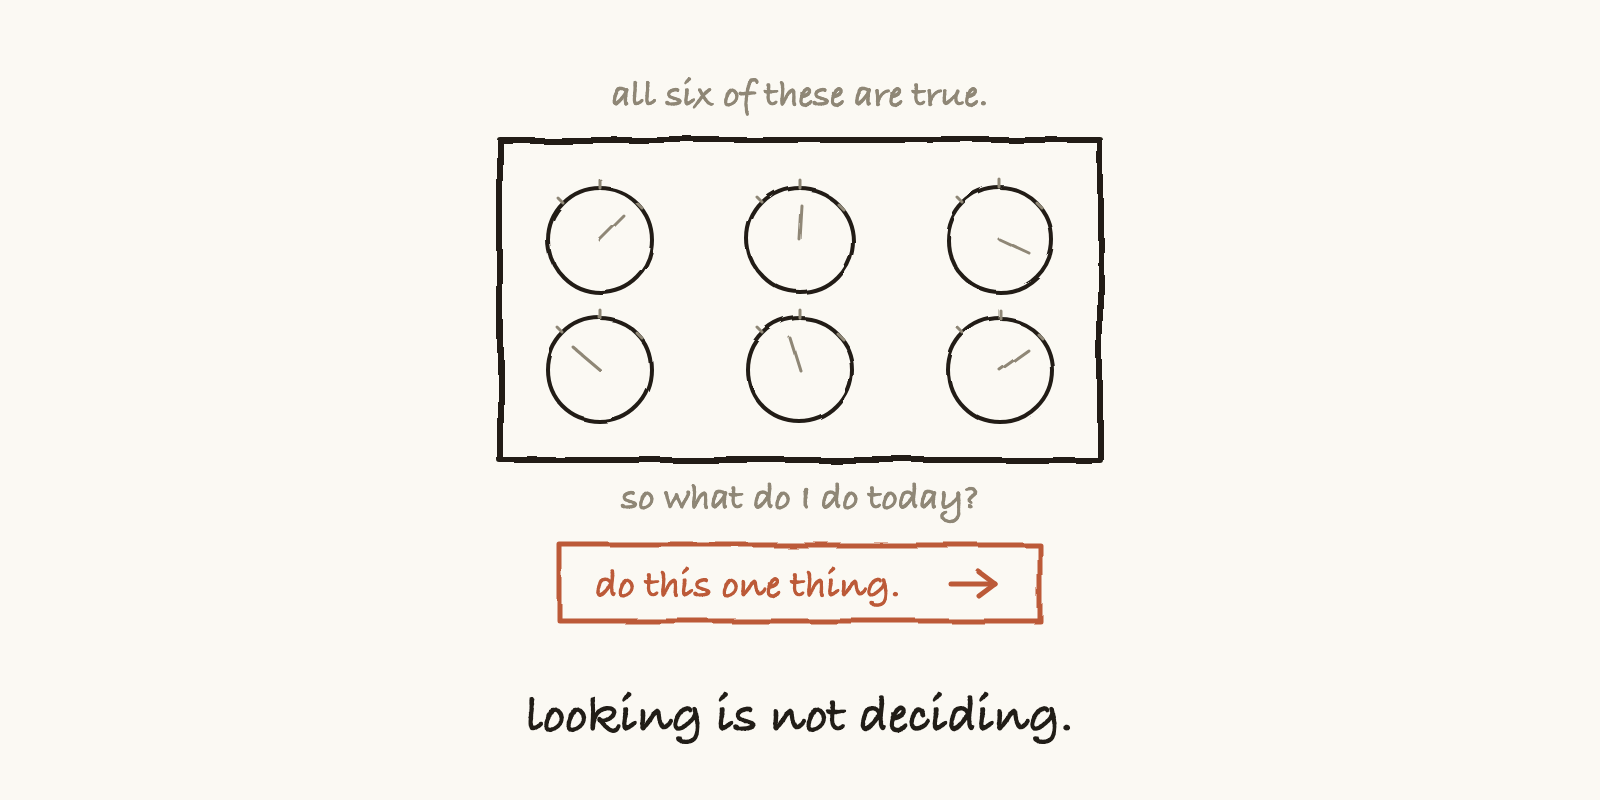
There's a morning ritual I see in a lot of businesses.
Coffee. Laptop. Open the analytics tab. Open the social tab. Open the sales tab. Look at the numbers. Feel something about them, usually not good. Close the tabs.
Then go and do exactly the same work you were going to do anyway.
That ritual can run for years. And here's the part worth sitting with: at no point in it does anyone make a decision.
It isn't just you. When Gartner surveyed 377 people who use marketing analytics for a living, they found the analytics influence just 53% of marketing decisions (Gartner, 2022). Nearly half of everything measured never touches a choice. And that's the professionals.
Looking feels like working
Building a dashboard is one of the most satisfying things you can do for a business. It's visible. It's tidy. It produces a screen you can show someone.
And it asks nothing of you.
Deciding is the expensive part. Deciding means picking one thing, doing it, and finding out you were wrong. Watching a chart of that same thing costs nothing and feels like the same activity. So we watch. We build better places to watch from. We add a number, then a graph, then a second screen for the graphs that didn't fit on the first one.
But the reality is, a dashboard's job ends at exactly the point where your job starts. It can tell you the room is cold. It has no opinion about the thermostat.
The question every number has to answer
Here's a test that takes about four seconds per number. Call it the Four-Second Test — it's the only filter your numbers ever need to pass.
What would I do differently tomorrow if this number were double? What if it were half?
If the answer to both is "nothing," then that number is there to be looked at. Nothing more.
Try it on the ones you check most. Follower count. Impressions. Page views for the month. For most business owners, doubling any of those changes nothing about tomorrow, because the real next move — fix the page, call the ten people who replied, raise the price — was never waiting on that number in the first place.
Now try it on a different one: 400 people saw the page, 2 did anything at all. Double the 400 and you'd keep doing whatever is bringing them. Halve the 2 and you'd stop everything and go read your own page like a stranger. That number has a grip on tomorrow. That's what earns it the screen space.
The numbers that quietly cost you
Some numbers are worse than useless, and it's worth naming why.
A score out of 100 is the clearest example. "Your business health: 62." It feels like the most informative thing on the page. But nobody can tell you what the 62 is made of, what a 70 would require, or whether a 62 in your business means what it means in someone else's. It's a number wearing a costume.
The same goes for any number placed next to a cause it can't prove. Sales rose 14% the week you started posting more. Did the posting do it? Maybe. Or the season turned, or one big client happened to close, or 14% is just noise on a small base. A dashboard will happily set those two facts side by side and let you draw the line yourself. You'll draw it wrong about half the time, and you'll feel equally certain either way.
A wrong number you trust does more damage than no number at all. That's the whole reason to be strict about this.
Where we drew our own line
We should be straight about our own house here, because we built a product with an opinion on this.
The scan hands you one move. Not a panel of scores, not a health rating, not a grid of things to keep an eye on. One thing to do next, and the reason it came first. The rule we set for the working screen is that nothing appears on it unless it changes what you do in the next hour.
We did build one screen with numbers on it. It shows how many pieces of copy you've written and what mix of situations they came from. We argued about that screen for a while, and we let it in for one reason: those numbers are a mirror of your own real work. Things you actually did, counted honestly.
What we didn't let in was a progress score. There is no bar filling up, no percentage, no "you're 40% of the way to a good business." Not because it would be hard to build. Because we can't prove it, and a confident number we can't prove is the WORST thing we could hand you.
That's the line, and it's worth stealing: a number you put in front of a founder should be something they did or something a customer did. Never a verdict on how they're doing.
This week
Open whatever you currently check. Go down it number by number and ask the four-second question. If this doubled, what would I do differently?
Most of them won't survive. Let them go. You are allowed to stop looking at things.
Then find the two that do survive. For most businesses it's how many people arrived and how many did anything at all — the two-number baseline every real diagnosis starts from, and the raw material for the one number that makes traffic decisions obvious. Put those somewhere you'll see them once a week. Not once a morning. Once a week is often enough to notice a trend and rare enough that you'll spend the other six days doing the work.
If you want the short version of all of it: your business doesn't need a better view of the problem. It needs the next move.
That's what we built iFactor to hand you. It reads your page, names the one thing to fix first, and shows you why it picked that one. Then it gets out of the way, which is the most any screen can really do for you.
Written by Mboso